Reports
The Reports section in Task Manager enables access to analytical data views and statistics regarding team work, task completion, and monitoring indicators (e.g., SLA). Access to reports is controlled by user permissions.
Access to reports
The reports section is accessible from the sidebar of the main Task Manager menu. Upon entering the section, the user sees a list of reports available for their role and permissions.
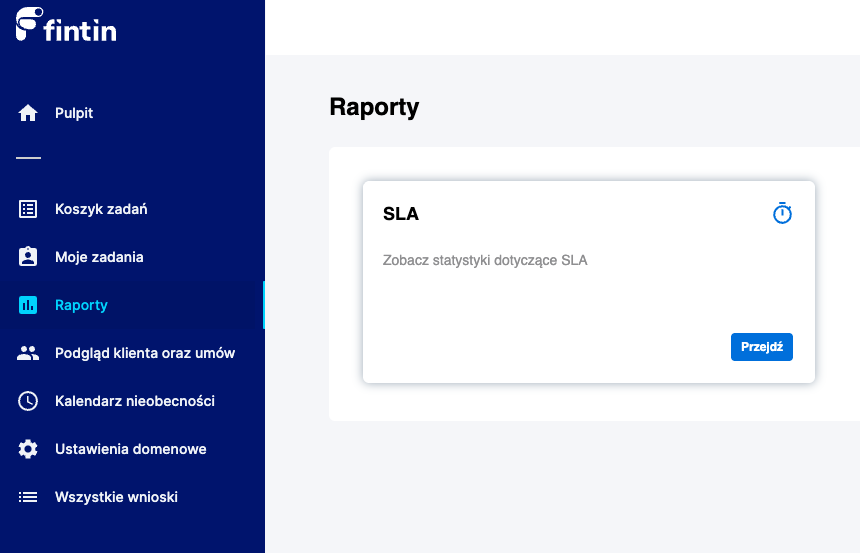
Main view of the reports section where each tile corresponds to its own report
Available reports
The list of reports is not fixed but depends on the specifics of the Fintin tool implementation, meaning it can be different for each user depending on:
- System permissions - different roles have access to different report sets
- Assigned groups/baskets - reports concerning only the user's areas of responsibility
- System configuration - administrators can define the availability of individual reports
Report types
Various categories of reports may be available:
- SLA reports - monitoring task and process completion times
- Performance reports - team and user work statistics
- Process reports - analysis of task flow through different stages
- Business reports - indicators related to customer service
Functionalities
Report selection
After clicking on a selected report from the list, the system navigates to a dedicated view containing:
- Data specified for the given report type
- Interactive charts and visualizations
- Detailed data tables
- Filtering options and view personalization
Display configuration
Depending on the report type, various options are available:
- Time ranges - day, week, month, year
- Data filtering - by users, groups, statuses
- Data export - ability to download reports in various formats
Example: SLA Report
One of the key reports available in the system is the SLA Report, which provides comprehensive monitoring of task and process completion times.
Access to SLA report
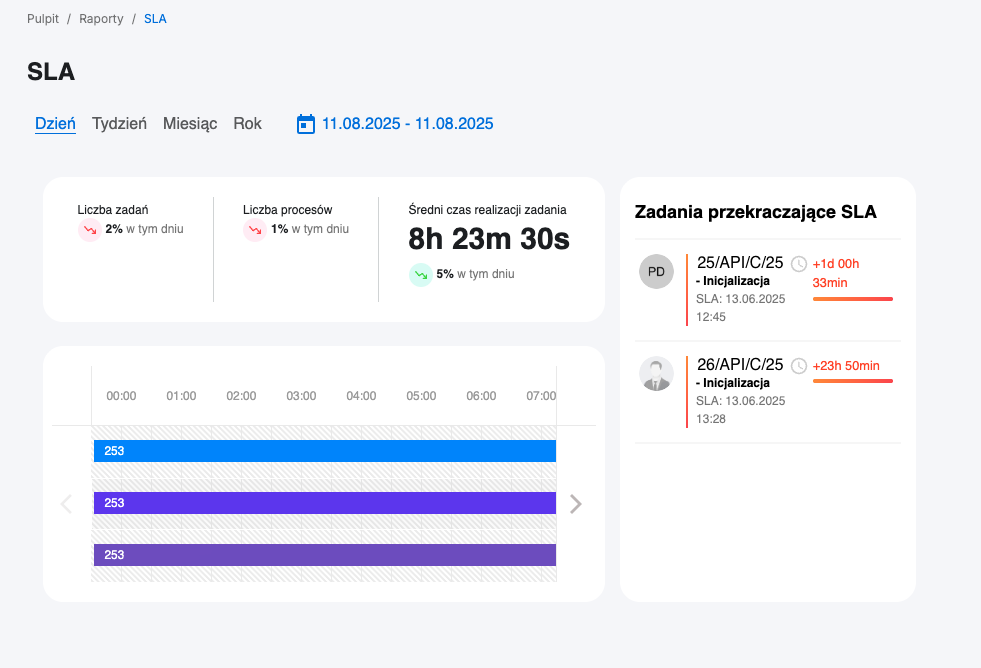
Dashboard with main indicators and access to detailed SLA reports
SLA report sections
The SLA report consists of several key analytical sections:
Main statistics
- Number of tasks - total number of tasks with percentage change compared to the previous year
- Number of processes - sum of processes being carried out with annual comparison
- Average task completion time - expressed in hours, minutes, and seconds with annual trend
Time-based completion chart
Interactive chart presenting:
- Time breakdown - ability to display data broken down by day/week/month/year
- Case numbers - all cases that were/are being handled in the selected period
- Details on hover - additional information displayed when hovering over a specific application
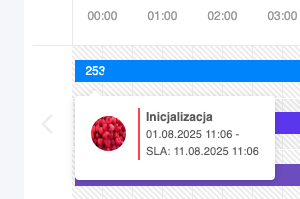
Popup with detailed case information when hovering over a point on the chart
Details displayed on hover include:
- Case number - application/task identifier
- Task name - description of the type of activities performed
- Exceeded SLA - information about time exceeded (if occurred)
- Assigned user - person responsible for completion
Tasks exceeding SLA
Dedicated section showing the latest tasks with exceeded SLA containing:
- Case number - problematic task identifier
- Task name - detailed activity description
- SLA exceedance amount - exact delay time
- Assigned user - person responsible for the task
Benefits of the SLA report
Performance monitoring
- Trend tracking - analysis of team performance over time
- Bottleneck identification - detection of problematic process areas
- Period comparisons - benchmarking against previous periods
Quality management
- Proactive actions - early detection of tasks at risk of SLA exceedance
- Process optimization - data for improving procedures and workflows
- Accountability - transparency in task responsibility
Regular monitoring of SLA reports allows for proactive team workload management and ensuring high-quality customer service. Use the hover details feature to quickly identify problematic cases.